

Chapter 17 : Window operations
Chapter Learning Objectives
Various window operations on data frame.
Chapter Outline
import pyspark
from pyspark.sql import functions as func
from pyspark.sql import SparkSession
spark = SparkSession \
    .builder \
    .appName("Python Spark SQL basic example") \
    .config("spark.some.config.option", "some-value") \
    .getOrCreate()
from IPython.display import display_html
import pandas as pd
import numpy as np
def display_side_by_side(*args):
    html_str=''
    for df in args:
        html_str+=df.to_html(index=False)
        html_str+= "\xa0\xa0\xa0"*10
    display_html(html_str.replace('table','table style="display:inline"'),raw=True)
space = "\xa0" * 10
import panel as pn

css = """
div.special_table + table, th, td {
  border: 3px solid orange;
}
"""
pn.extension(raw_css=[css])
1. Window Operations
What are Window Functions?
A window function performs a calculation across a set of table rows that are somehow related to the current row. This is comparable to the type of calculation that can be done with an aggregate function. But unlike regular aggregate functions, use of a window function does not cause rows to become grouped into a single output row — the rows retain their separate identities. Behind the scenes, the window function is able to access more than just the current row of the query result.
In the DataFrame API, we provide utility functions to define a window specification. Taking Python as an example, users can specify partitioning expressions and ordering expressions as follows.
from pyspark.sql.window import Window
windowSpec =
Window
.partitionBy(…)
.orderBy(…)
In addition to the ordering and partitioning, users need to define the start boundary of the frame, the end boundary of the frame, and the type of the frame, which are three components of a frame specification.
There are five types of boundaries, which are unboundedPreceding, unboundedFollowing, currentRow,
unboundedPreceding and unboundedFollowing represent the first row of the partition and the last row of the partition, respectively.
For the other three types of boundaries, they specify the offset from the position of the current input row and their specific meanings are defined based on the type of the frame.
There are two types of frames, ROW frame and RANGE frame.
ROW frame
ROW frames are based on physical offsets from the position of the current input row, which means thatcurrentRow,
If currentRow is used as a boundary, it represents the current input row.
The following figure illustrates a ROW frame with a 1 Preceding as the start boundary and 1 FOLLOWING as the end boundary (ROWS BETWEEN 1 PRECEDING AND 1 FOLLOWING in the SQL syntax).
df = spark.createDataFrame([
    ("sales",10,6000),("hr",7,3000),("it",5,5000),("sales",2,6000),
    ("hr",3,2000),("hr",4,6000),("it",8,8000),("sales",9,5000),
    ("sales",1,7000),("it",6,6000)],
    ["dept_id","emp_id","salary"])
d1 = df.toPandas()
print(d1.to_string(index=False))#show(truncate=False)print()
dept_id  emp_id  salary
  sales      10    6000
     hr       7    3000
     it       5    5000
  sales       2    6000
     hr       3    2000
     hr       4    6000
     it       8    8000
  sales       9    5000
  sales       1    7000
     it       6    6000
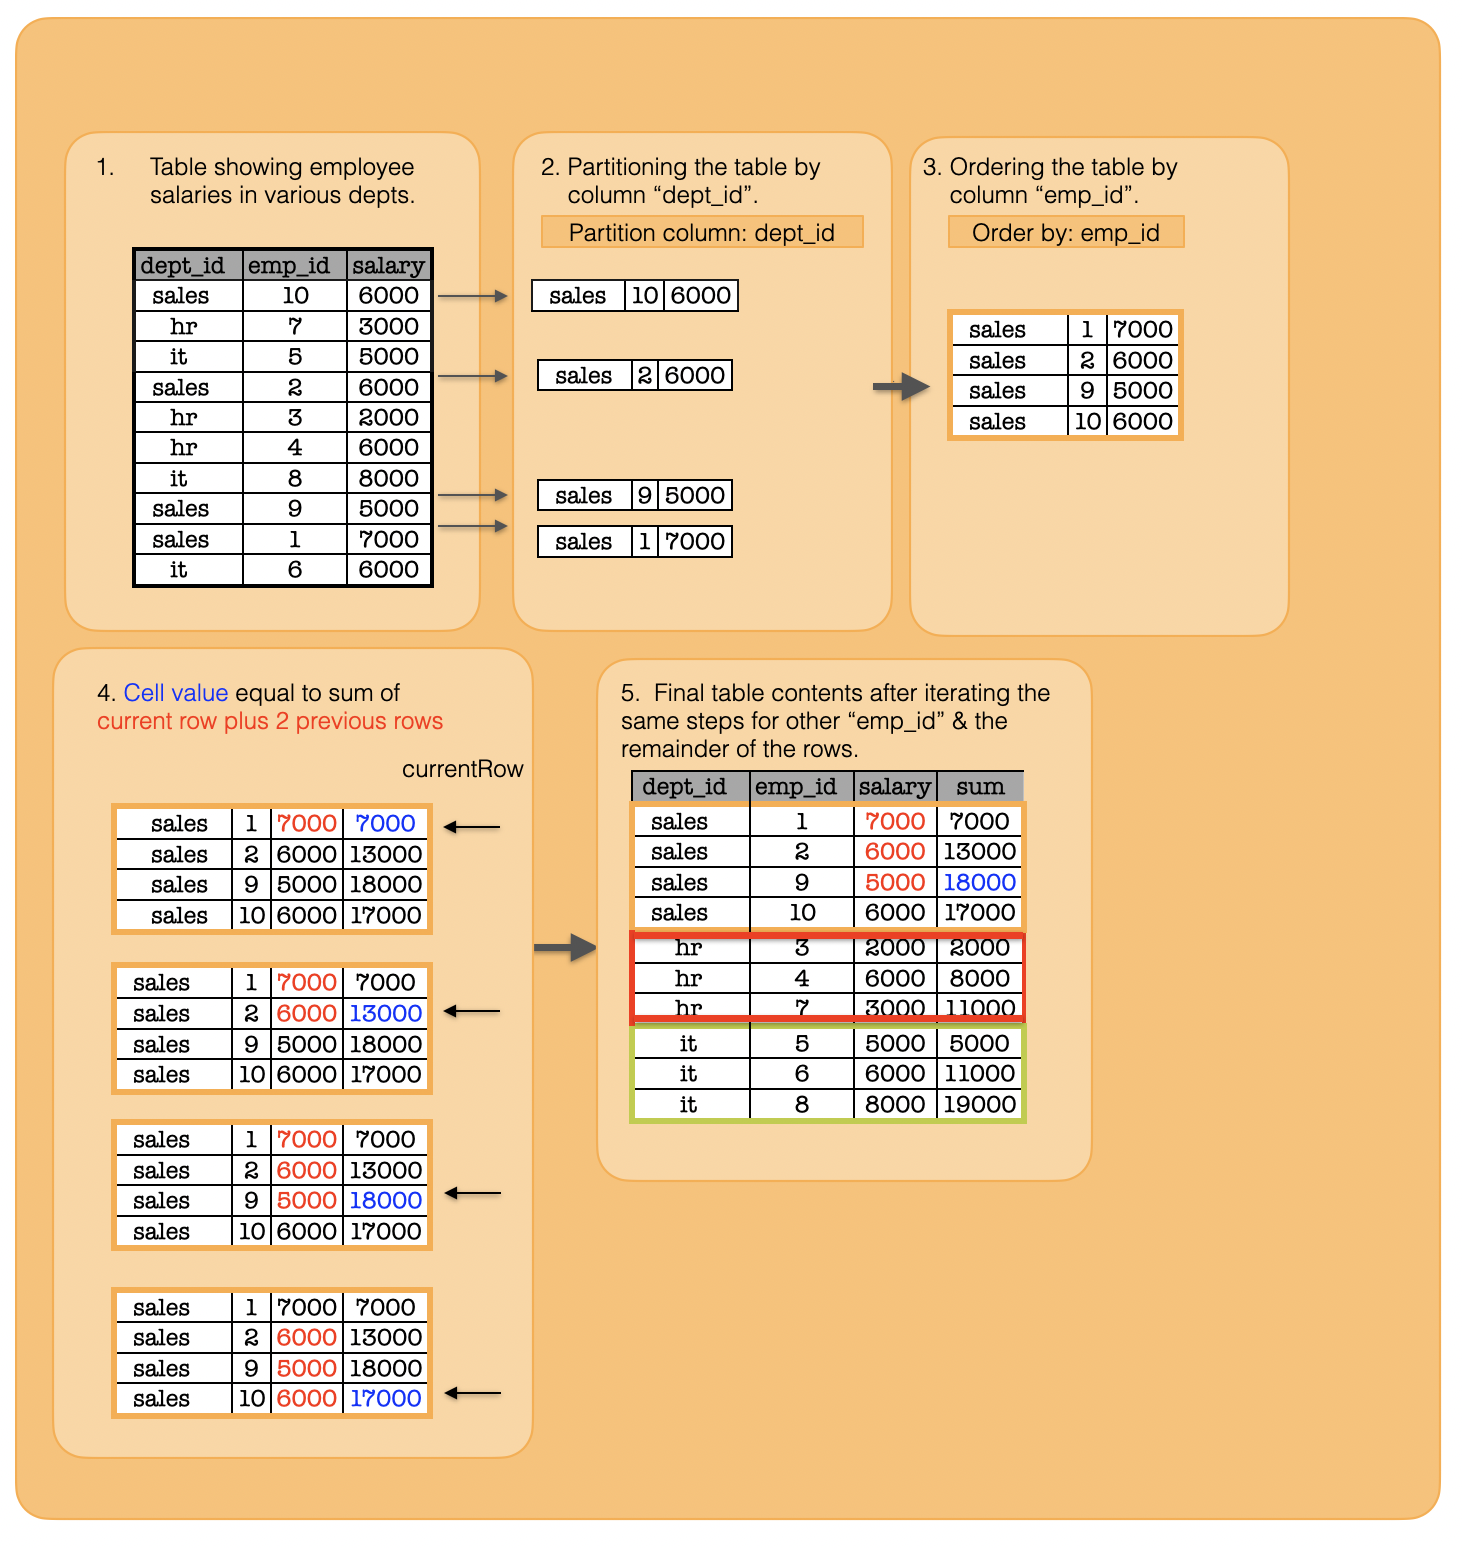
1a. How to calculate a new column for each group whose row value is equal to sum of the current row and previous 2 rows?
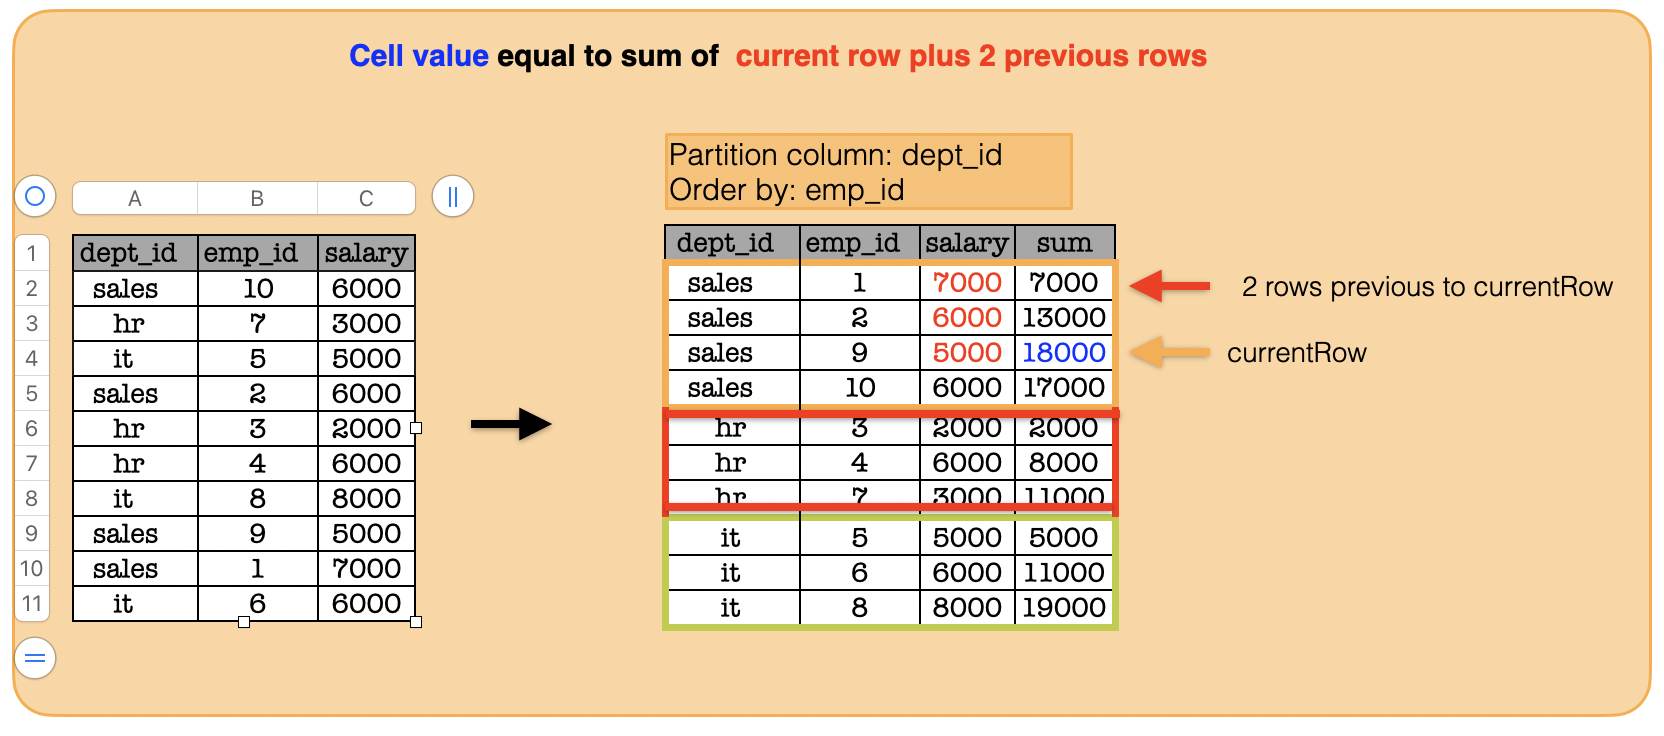
from pyspark.sql import functions as func
from pyspark.sql import Window
window = Window.partitionBy("dept_id").orderBy("emp_id").rowsBetween(-2,  0)
print(df.withColumn("sum", func.sum("salary").over(window)).toPandas().to_string(index=False))#show()
dept_id  emp_id  salary   sum
  sales       1    7000  7000
  sales       2    6000 13000
  sales       9    5000 18000
  sales      10    6000 17000
     hr       3    2000  2000
     hr       4    6000  8000
     hr       7    3000 11000
     it       5    5000  5000
     it       6    6000 11000
     it       8    8000 19000
1b. How to calculate a new column for each group whose row value is equal to sum of the current row and 2 following rows?
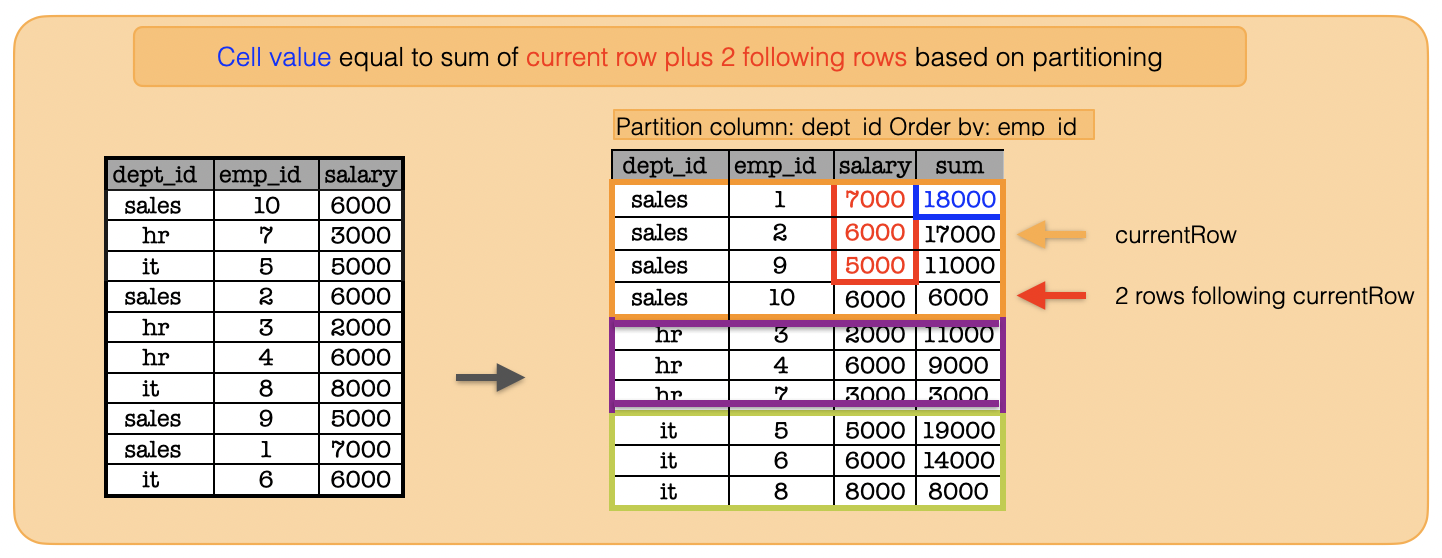
window = Window.partitionBy("dept_id").orderBy("emp_id").rowsBetween(0, 2)
print(df.withColumn("sum", func.sum("salary").over(window)).toPandas().to_string(index=False))#show()
dept_id  emp_id  salary   sum
  sales       1    7000 18000
  sales       2    6000 17000
  sales       9    5000 11000
  sales      10    6000  6000
     hr       3    2000 11000
     hr       4    6000  9000
     hr       7    3000  3000
     it       5    5000 19000
     it       6    6000 14000
     it       8    8000  8000
1c. How to calculate a new column whose row value is equal to sum of the current row and following 2 rows?
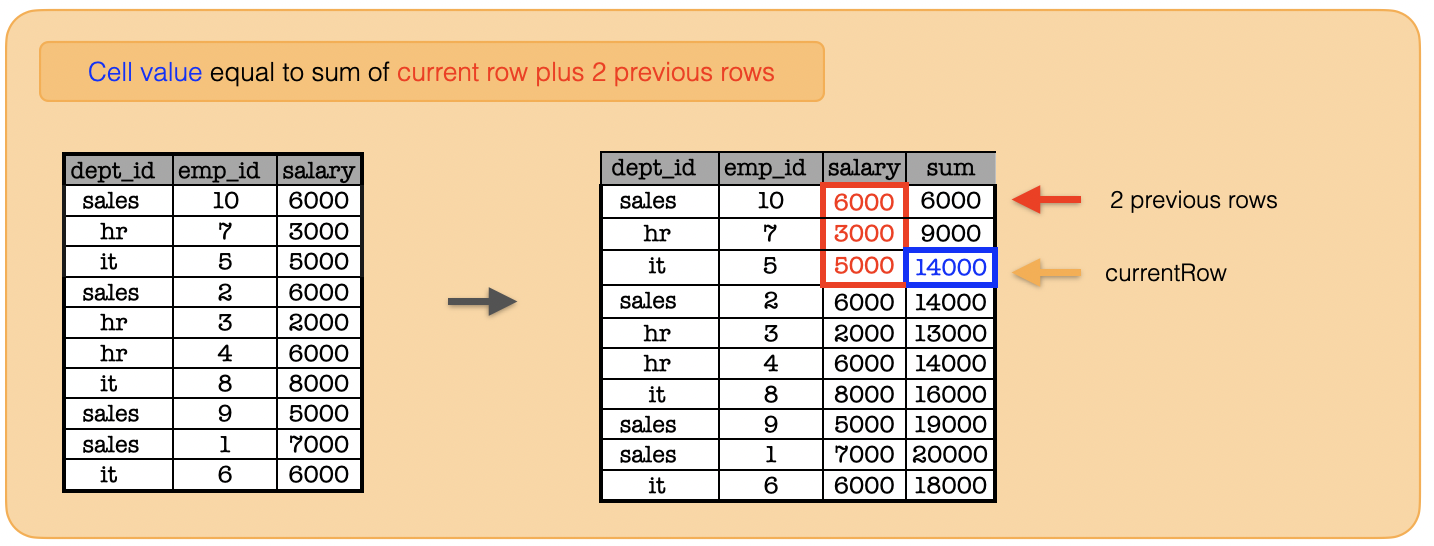
window = Window.rowsBetween(-2,  0)
print(df.withColumn("sum", func.sum("salary").over(window)).toPandas().to_string(index=False))#show()
dept_id  emp_id  salary   sum
  sales      10    6000  6000
     hr       7    3000  9000
     it       5    5000 14000
  sales       2    6000 14000
     hr       3    2000 13000
     hr       4    6000 14000
     it       8    8000 16000
  sales       9    5000 19000
  sales       1    7000 20000
     it       6    6000 18000
1d. How to calculate a new column whose row value is equal to sum of the current row and following 1 row?
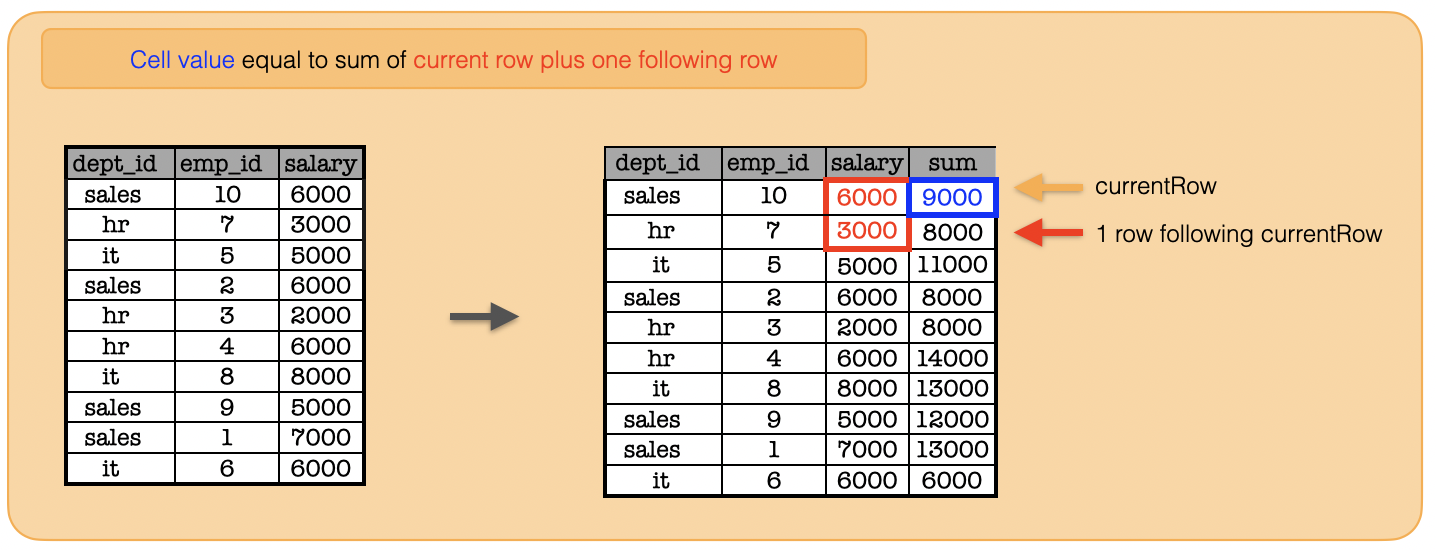
window = Window.rowsBetween(0,  1)
df.withColumn("sum", func.sum("salary").over(window)).show()
print(df.withColumn("sum", func.sum("salary").over(window)).toPandas().to_string(index=False))
+-------+------+------+-----+
|dept_id|emp_id|salary|  sum|
+-------+------+------+-----+
|  sales|    10|  6000| 9000|
|     hr|     7|  3000| 8000|
|     it|     5|  5000|11000|
|  sales|     2|  6000| 8000|
|     hr|     3|  2000| 8000|
|     hr|     4|  6000|14000|
|     it|     8|  8000|13000|
|  sales|     9|  5000|12000|
|  sales|     1|  7000|13000|
|     it|     6|  6000| 6000|
+-------+------+------+-----+
dept_id  emp_id  salary   sum
  sales      10    6000  9000
     hr       7    3000  8000
     it       5    5000 11000
  sales       2    6000  8000
     hr       3    2000  8000
     hr       4    6000 14000
     it       8    8000 13000
  sales       9    5000 12000
  sales       1    7000 13000
     it       6    6000  6000
1e. How to calculate the dense rank?
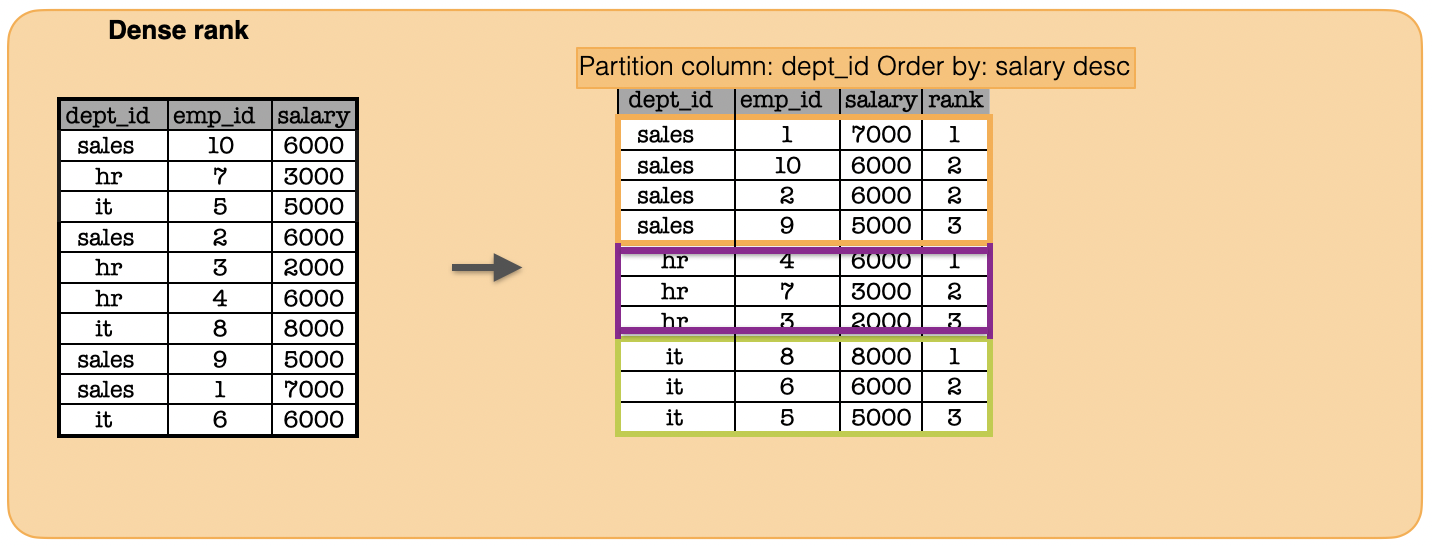
window = Window.partitionBy("dept_id").orderBy(func.col("salary").desc())
print(df.withColumn("rank", func.dense_rank().over(window)).toPandas().to_string(index=False))#show()
dept_id  emp_id  salary  rank
  sales       1    7000     1
  sales      10    6000     2
  sales       2    6000     2
  sales       9    5000     3
     hr       4    6000     1
     hr       7    3000     2
     hr       3    2000     3
     it       8    8000     1
     it       6    6000     2
     it       5    5000     3
1f. How to calculate the rank?
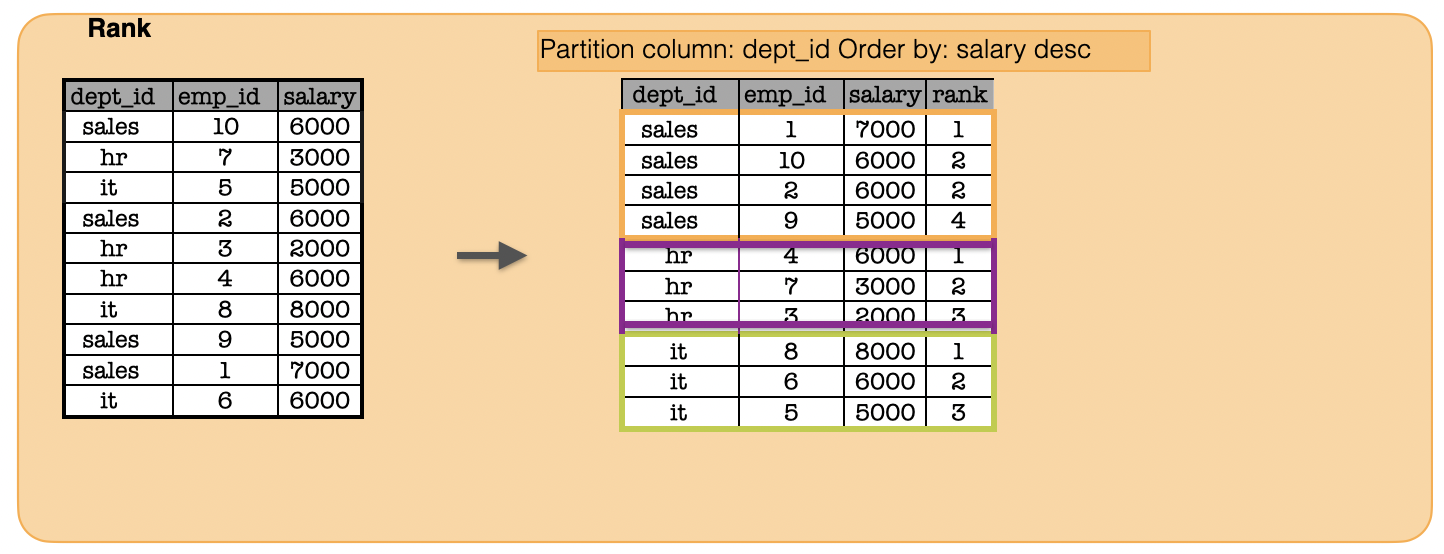
window = Window.partitionBy("dept_id").orderBy(func.col("salary").desc())
print(df.withColumn("rank", func.rank().over(window)).toPandas().to_string(index=False))#show()
dept_id  emp_id  salary  rank
  sales       1    7000     1
  sales      10    6000     2
  sales       2    6000     2
  sales       9    5000     4
     hr       4    6000     1
     hr       7    3000     2
     hr       3    2000     3
     it       8    8000     1
     it       6    6000     2
     it       5    5000     3
1g. How to calculate the ntile?
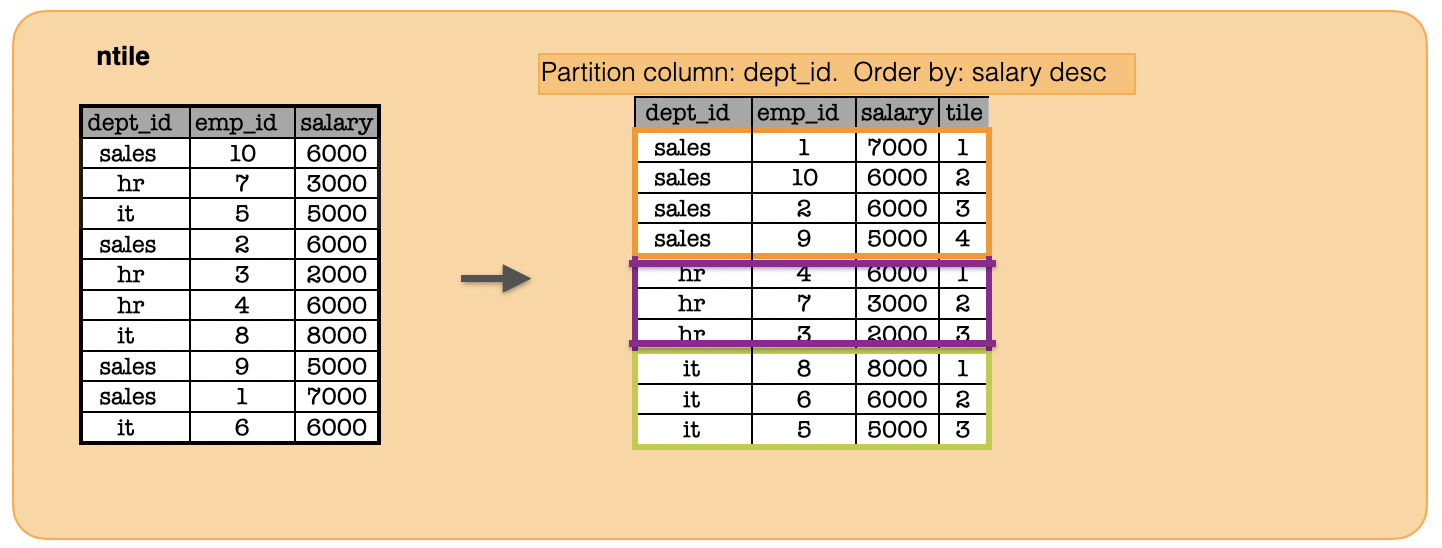
window = Window.partitionBy("dept_id").orderBy(func.col("salary").desc())
print(df.withColumn("salary_bucket", func.ntile(4).over(window)).toPandas().to_string(index=False))#show()
dept_id  emp_id  salary  salary_bucket
  sales       1    7000              1
  sales      10    6000              2
  sales       2    6000              3
  sales       9    5000              4
     hr       4    6000              1
     hr       7    3000              2
     hr       3    2000              3
     it       8    8000              1
     it       6    6000              2
     it       5    5000              3
1h. How to calculate the lag?
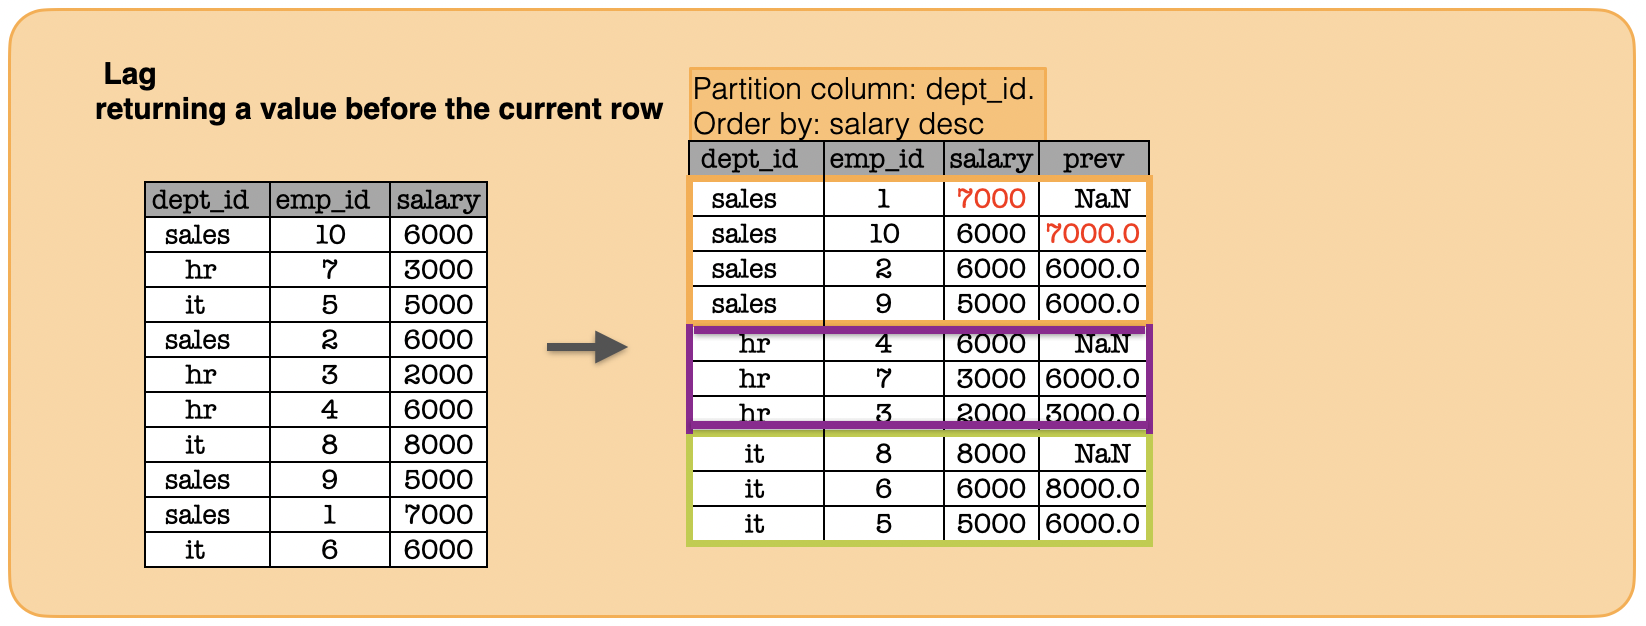
window = Window.partitionBy("dept_id").orderBy(func.col("salary").desc())
print(df.withColumn("previousrow_salary", func.lag('salary',1).over(window)).toPandas().to_string(index=False))#.show()
dept_id  emp_id  salary  previousrow_salary
  sales       1    7000                 NaN
  sales      10    6000              7000.0
  sales       2    6000              6000.0
  sales       9    5000              6000.0
     hr       4    6000                 NaN
     hr       7    3000              6000.0
     hr       3    2000              3000.0
     it       8    8000                 NaN
     it       6    6000              8000.0
     it       5    5000              6000.0
1i. How to calculate the lead?
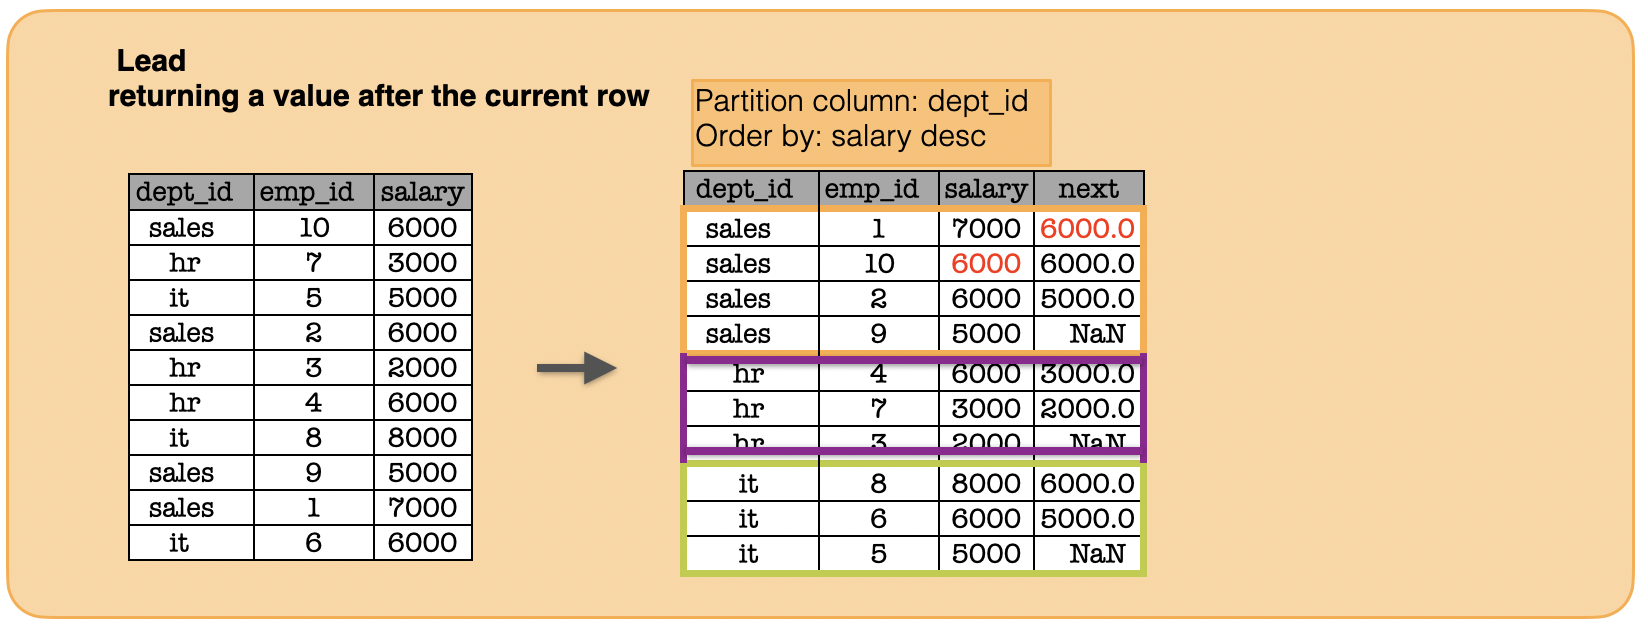
window = Window.partitionBy("dept_id").orderBy(func.col("salary").desc())
print(df.withColumn("nextrow_salary", func.lead('salary',1).over(window)).toPandas().to_string(index=False))#show()
dept_id  emp_id  salary  nextrow_salary
  sales       1    7000          6000.0
  sales      10    6000          6000.0
  sales       2    6000          5000.0
  sales       9    5000             NaN
     hr       4    6000          3000.0
     hr       7    3000          2000.0
     hr       3    2000             NaN
     it       8    8000          6000.0
     it       6    6000          5000.0
     it       5    5000             NaN
1j. How to calculate the percent rank?
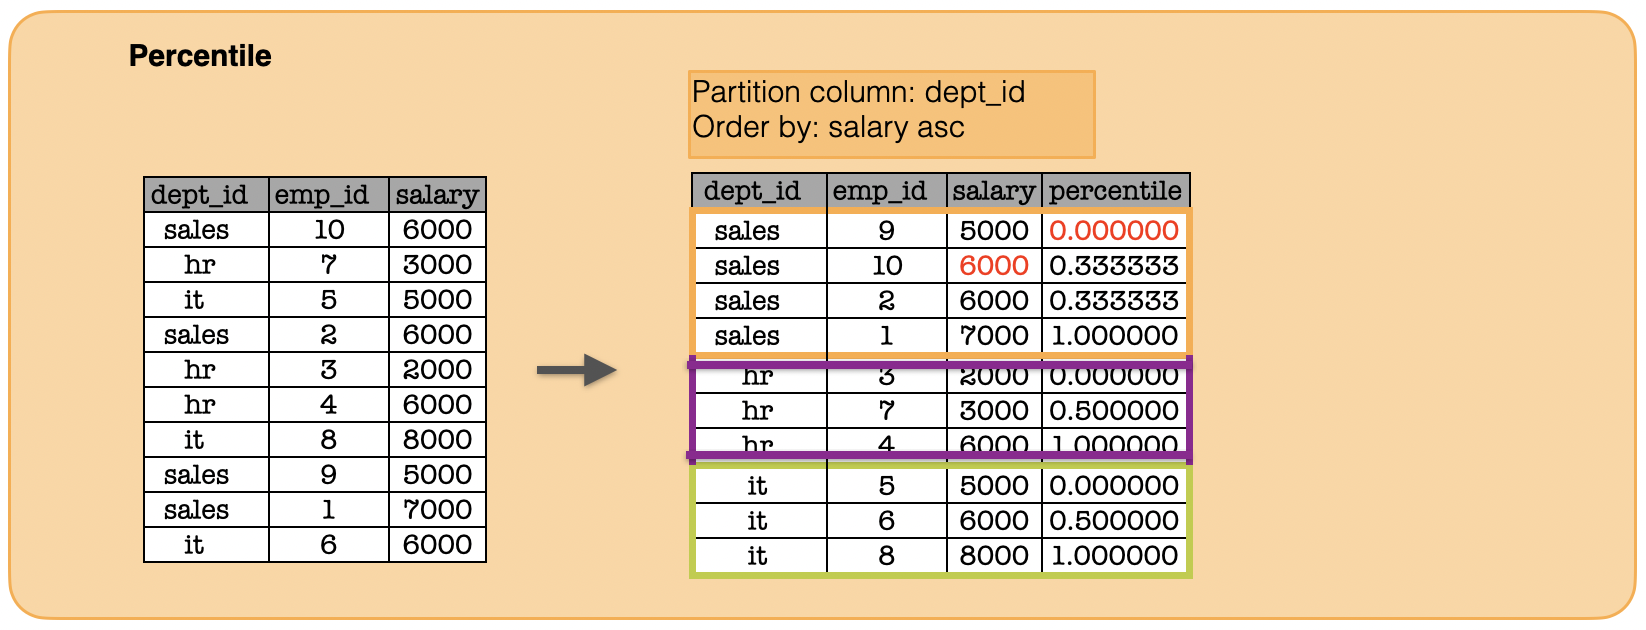
window = Window.partitionBy("dept_id").orderBy(func.col("salary"))
print(df.withColumn("percentile", func.percent_rank().over(window)).toPandas().to_string(index=False))#show()
dept_id  emp_id  salary  percentile
  sales       9    5000    0.000000
  sales      10    6000    0.333333
  sales       2    6000    0.333333
  sales       1    7000    1.000000
     hr       3    2000    0.000000
     hr       7    3000    0.500000
     hr       4    6000    1.000000
     it       5    5000    0.000000
     it       6    6000    0.500000
     it       8    8000    1.000000
1k. How to calculate the row number?
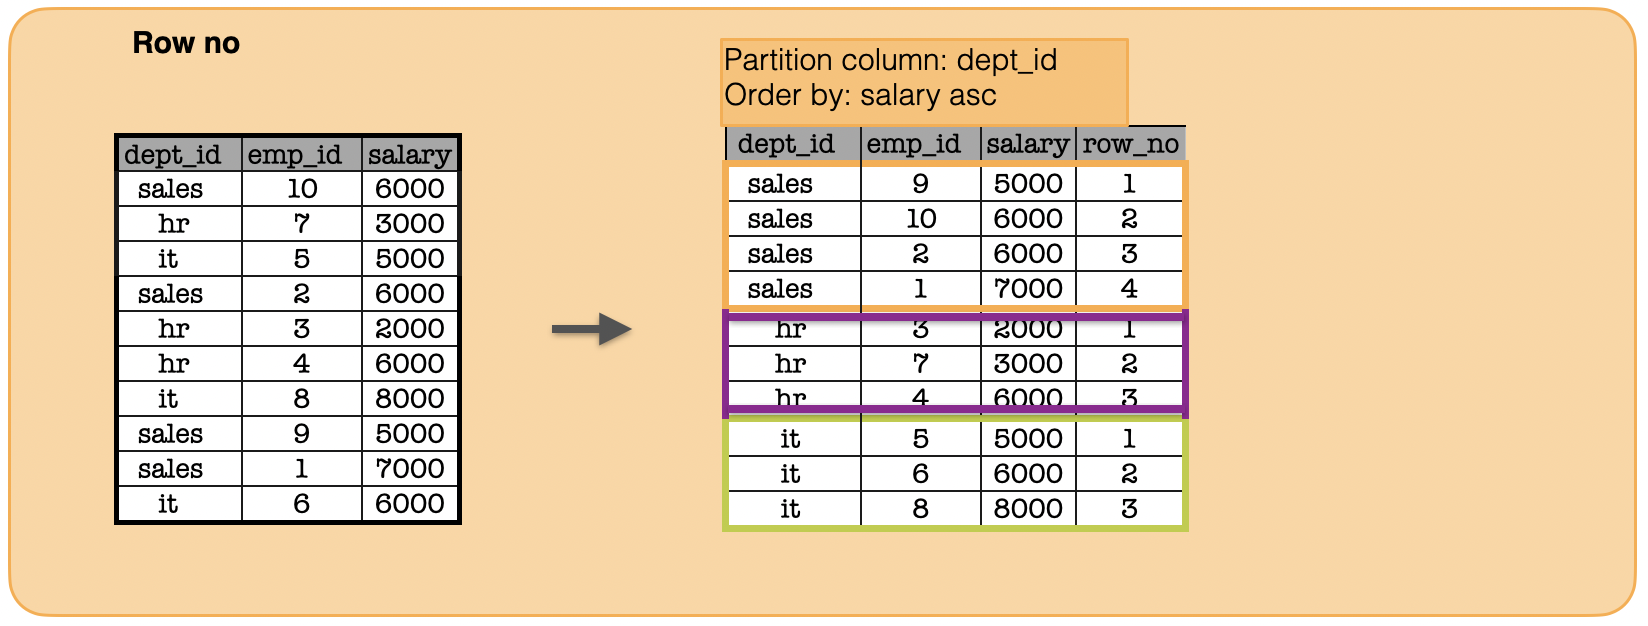
window = Window.partitionBy("dept_id").orderBy(func.col("salary"))
print(df.withColumn("row_no", func.row_number().over(window)).toPandas().to_string(index=False))#show()
dept_id  emp_id  salary  row_no
  sales       9    5000       1
  sales      10    6000       2
  sales       2    6000       3
  sales       1    7000       4
     hr       3    2000       1
     hr       7    3000       2
     hr       4    6000       3
     it       5    5000       1
     it       6    6000       2
     it       8    8000       3
1l. How to calculate the cume dist?
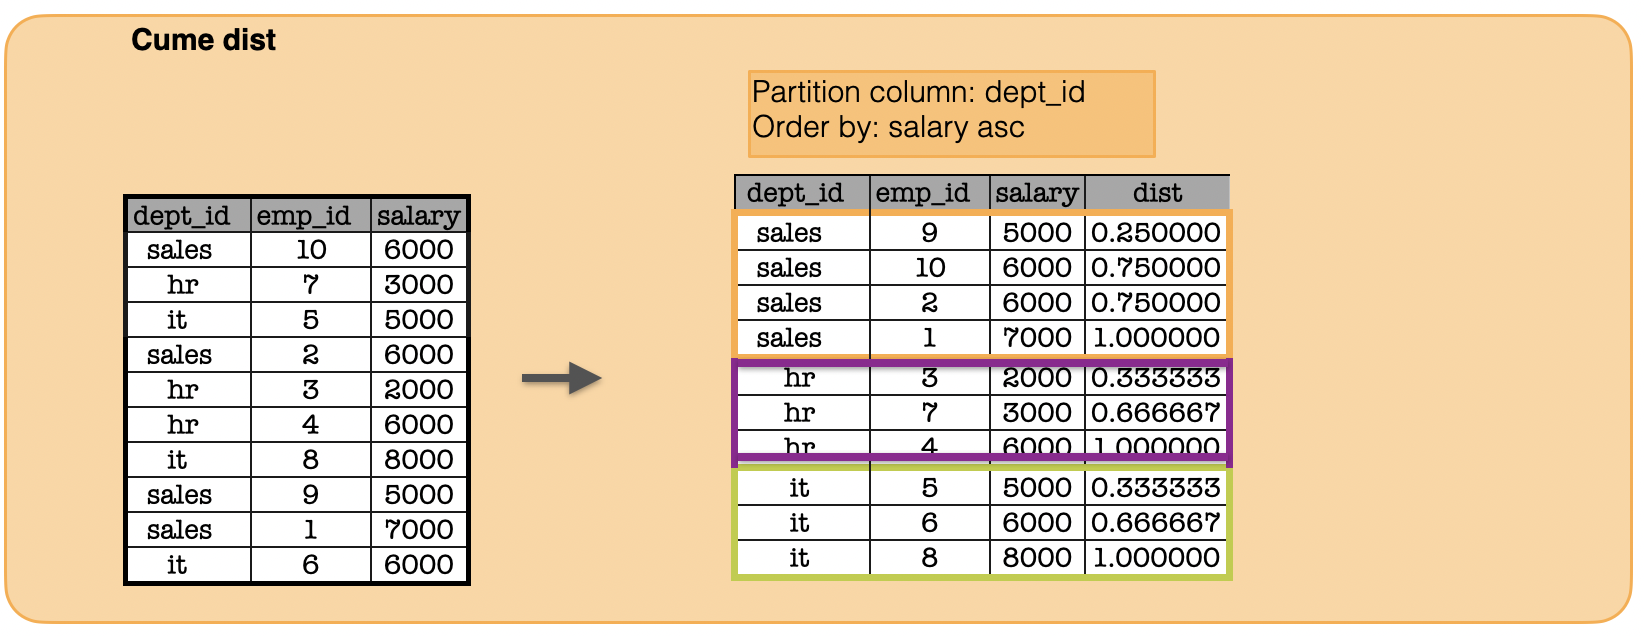
window = Window.partitionBy("dept_id").orderBy(func.col("salary"))
print(df.withColumn("cume_dist", func.cume_dist().over(window)).toPandas().to_string(index=False))#show()
dept_id  emp_id  salary  cume_dist
  sales       9    5000   0.250000
  sales      10    6000   0.750000
  sales       2    6000   0.750000
  sales       1    7000   1.000000
     hr       3    2000   0.333333
     hr       7    3000   0.666667
     hr       4    6000   1.000000
     it       5    5000   0.333333
     it       6    6000   0.666667
     it       8    8000   1.000000