

Chapter 2 : DataFrames
Learning Objectives
Understand dataframe basics.
Create syntax to create spark dataframe from different data sources.
Basic dataframe operations.
Chapter Outline
from IPython.display import display_html
import pandas as pd
import numpy as np
def display_side_by_side(*args):
    html_str=''
    for df in args:
        html_str+=df.to_html(index=False)
        html_str+= "\xa0\xa0\xa0"*10
    display_html(html_str.replace('table','table style="display:inline"'),raw=True)
space = "\xa0" * 10
1. What is spark dataframe?
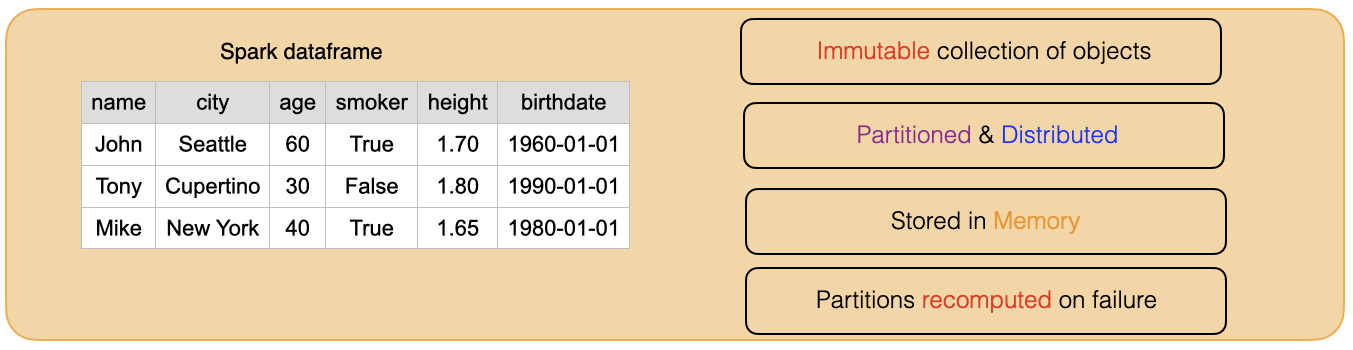
A DataFrame simply represents a table of data with rows and columns. A simple analogy would be a spreadsheet with named columns.
Spark DataFrame is a distributed collection of data organized into named columns. It can be constructed from a wide array of sources such as: structured data files, tables in Hive, external databases, or existing RDD, Lists, Pandas data frame.
Immutable in nature : We can create DataFrame once but can’t change it. And we can transform a DataFrame after applying transformations.
Lazy Evaluations: This means that a task is not executed until an action is performed.
Distributed: DataFrame is distributed in nature.
All transformations in Spark are lazy, in that they do not compute their results right away. Instead, they just remember the transformations applied to some base dataset (e.g. a file). The transformations are only computed when an action requires a result to be returned to the driver program. This design enables Spark to run more efficiently.
Advantages of lazy evaluation.
It is an optimization technique i.e. it provides optimization by reducing the number of queries.
It saves the round trips between driver and cluster, thus speeds up the process.
Saves Computation and increases Speed
Why are DataFrames Useful ?
DataFrames are designed for processing large collections of structured or semi-structured data. Observations in Spark DataFrame are organised under named columns, which helps Apache Spark to understand the schema of a DataFrame. This helps Spark optimize execution plan on these queries.
DataFrame in Apache Spark has the ability to handle petabytes of data.
DataFrame has a support for a wide range of data formats and sources.
All transformations in Spark are lazy, in that they do not compute their results right away. Instead, they just remember the transformations applied to some base dataset (e.g. a file).
2. Creating a spark dataframe
Lets first understand the syntax
Syntax
createDataFrame(data, schema=None, samplingRatio=None, verifySchema=True)
Parameters:
data – RDD,list, or pandas.DataFrame.
schema – a pyspark.sql.types.DataType or a datatype string or a list of column names, default is None.
samplingRatio – the sample ratio of rows used for inferring
verifySchema – verify data types of every row against schema.
2a. from RDD
What is RDD?
Resilient Distributed Datasets (RDDs)
At a high level, every Spark application consists of a driver program that runs the user’s main function and executes various parallel operations on a cluster.
The main abstraction Spark provides is a resilient distributed dataset (RDD), which is a collection of elements partitioned across the nodes of the cluster that can be operated on in parallel.
RDDs are created by starting with a file in the Hadoop file system (or any other Hadoop-supported file system), or an existing Scala collection in the driver program, and transforming it.
Users may also ask Spark to persist an RDD in memory, allowing it to be reused efficiently across parallel operations. Finally, RDDs automatically recover from node failures.
How to create RDD?
import pyspark
from pyspark.sql import SparkSession
spark = SparkSession \
    .builder \
    .appName("Python Spark SQL basic example") \
    .config("spark.some.config.option", "some-value") \
    .getOrCreate()
rdd_spark = spark.sparkContext.parallelize([('John', 'Seattle', 60, True, 1.7, '1960-01-01'),
 ('Tony', 'Cupertino', 30, False, 1.8, '1990-01-01'),
 ('Mike', 'New York', 40, True, 1.65, '1980-01-01')]).collect()
print(rdd_spark)
[('John', 'Seattle', 60, True, 1.7, '1960-01-01'), ('Tony', 'Cupertino', 30, False, 1.8, '1990-01-01'), ('Mike', 'New York', 40, True, 1.65, '1980-01-01')]
pd.set_option('display.max_colwidth', 40)
pd.DataFrame([[rdd_spark]])
| 0 | |
|---|---|
| 0 | [(John, Seattle, 60, True, 1.7, 1960... |
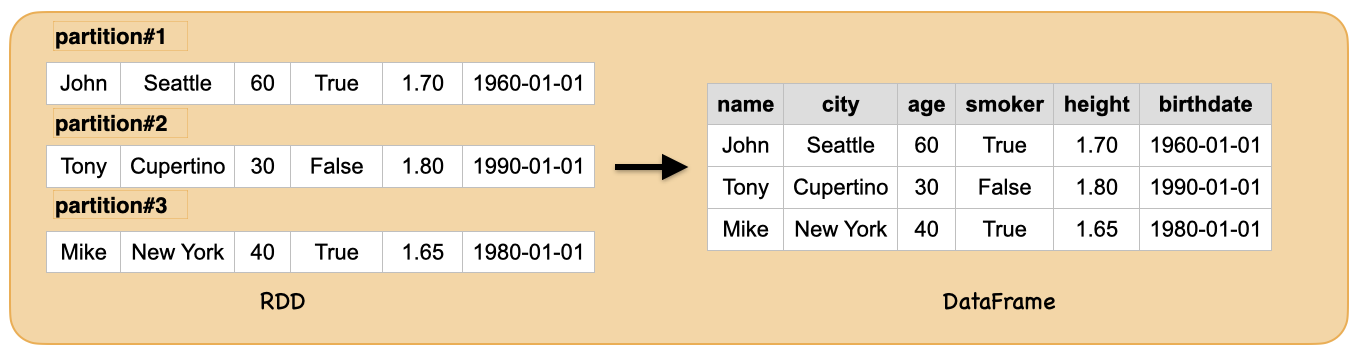
Creating a spark dataframe from RDD:
df = spark.createDataFrame(rdd_spark)
df.show()
+----+---------+---+-----+----+----------+
|  _1|       _2| _3|   _4|  _5|        _6|
+----+---------+---+-----+----+----------+
|John|  Seattle| 60| true| 1.7|1960-01-01|
|Tony|Cupertino| 30|false| 1.8|1990-01-01|
|Mike| New York| 40| true|1.65|1980-01-01|
+----+---------+---+-----+----+----------+
pd.set_option('display.max_colwidth', 20)
print("Input                                               ",            "Output")
display_side_by_side(pd.DataFrame([[rdd_spark]]),df.toPandas())
Input Output
| 0 |
|---|
| [(John, Seattle, 60, True, 1.7, 1960-01-01), (Tony, Cupertino, 30, False, 1.8, 1990-01-01), (Mike, New York, 40, True, 1.65, 1980-01-01)] |
| _1 | _2 | _3 | _4 | _5 | _6 |
|---|---|---|---|---|---|
| John | Seattle | 60 | True | 1.70 | 1960-01-01 |
| Tony | Cupertino | 30 | False | 1.80 | 1990-01-01 |
| Mike | New York | 40 | True | 1.65 | 1980-01-01 |
2b. from List
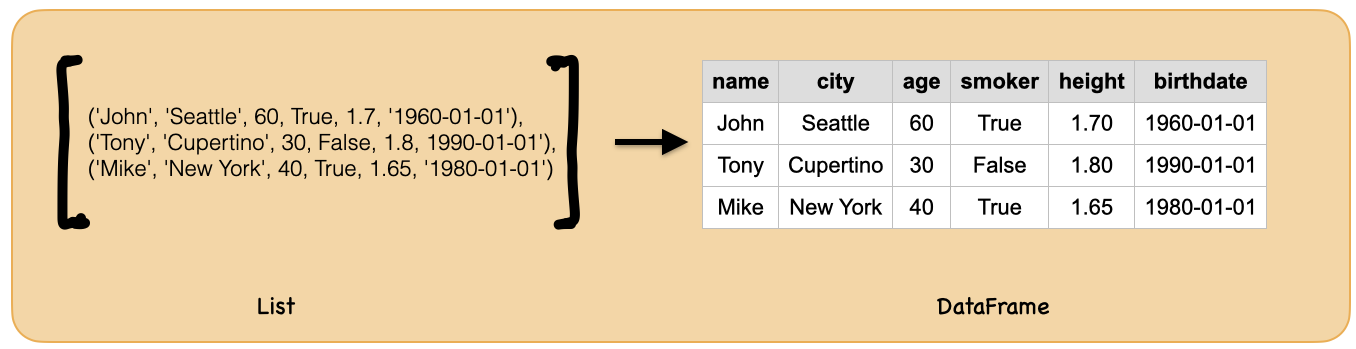
alist = [('John', 'Seattle', 60, True, 1.7, '1960-01-01'),
('Tony', 'Cupertino', 30, False, 1.8, '1990-01-01'),
('Mike', 'New York', 40, True, 1.65, '1980-01-01')]
spark.createDataFrame(alist).show()
+----+---------+---+-----+----+----------+
|  _1|       _2| _3|   _4|  _5|        _6|
+----+---------+---+-----+----+----------+
|John|  Seattle| 60| true| 1.7|1960-01-01|
|Tony|Cupertino| 30|false| 1.8|1990-01-01|
|Mike| New York| 40| true|1.65|1980-01-01|
+----+---------+---+-----+----+----------+
2c. from pandas dataframe
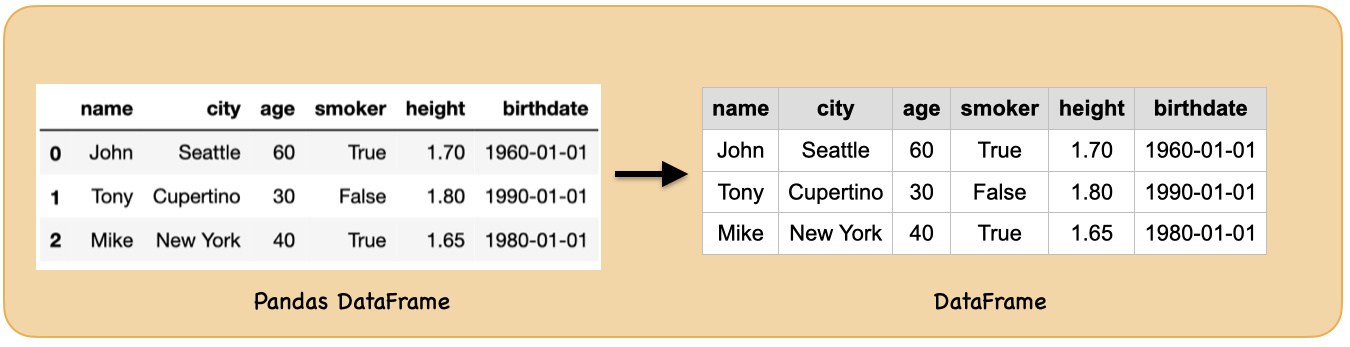
How to create pandas dataframe?
import pandas as pd
df_pd = pd.DataFrame([('John', 'Seattle', 60, True, 1.7, '1960-01-01'),
('Tony', 'Cupertino', 30, False, 1.8, '1990-01-01'),
('Mike', 'New York', 40, True, 1.65, '1980-01-01')],columns=["name","city","age","smoker","height", "birthdate"])
df_pd
| name | city | age | smoker | height | birthdate | |
|---|---|---|---|---|---|---|
| 0 | John | Seattle | 60 | True | 1.70 | 1960-01-01 |
| 1 | Tony | Cupertino | 30 | False | 1.80 | 1990-01-01 |
| 2 | Mike | New York | 40 | True | 1.65 | 1980-01-01 |
How to create spark dataframe from pandas dataframe
spark.createDataFrame(df_pd).show()
+----+---------+---+------+------+----------+
|name|     city|age|smoker|height| birthdate|
+----+---------+---+------+------+----------+
|John|  Seattle| 60|  true|   1.7|1960-01-01|
|Tony|Cupertino| 30| false|   1.8|1990-01-01|
|Mike| New York| 40|  true|  1.65|1980-01-01|
+----+---------+---+------+------+----------+
3. Basic data frame operations
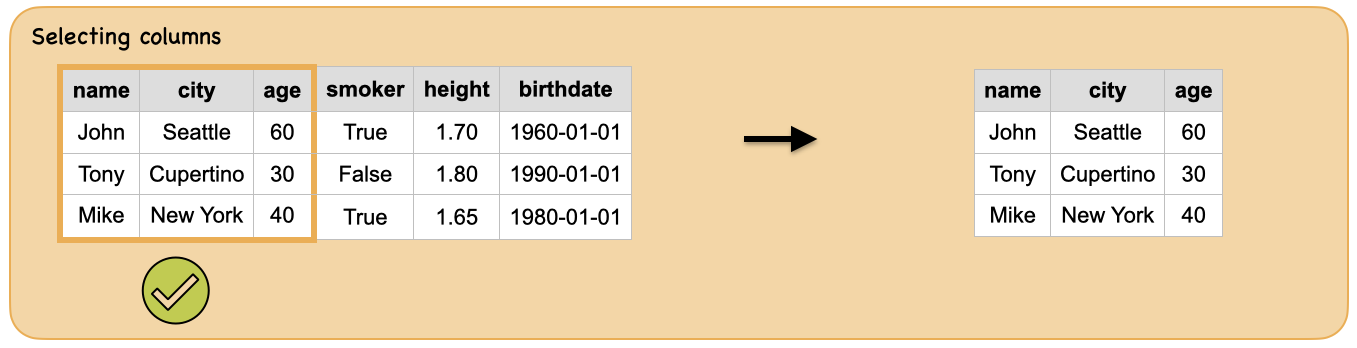
3a. How to select columns?
Input: Spark dataframe
df = spark.createDataFrame([('John', 'Seattle', 60, True, 1.7, '1960-01-01'),
('Tony', 'Cupertino', 30, False, 1.8, '1990-01-01'),
('Mike', 'New York', 40, True, 1.65, '1980-01-01')],['name', 'city', 'age', 'smoker','height', 'birthdate'])
df.show()
+----+---------+---+------+------+----------+
|name|     city|age|smoker|height| birthdate|
+----+---------+---+------+------+----------+
|John|  Seattle| 60|  true|   1.7|1960-01-01|
|Tony|Cupertino| 30| false|   1.8|1990-01-01|
|Mike| New York| 40|  true|  1.65|1980-01-01|
+----+---------+---+------+------+----------+
Output: spark dataframe with selected columns
Method#1
df_out = df.select("name","city","age")
df_out.show()
+----+---------+---+
|name|     city|age|
+----+---------+---+
|John|  Seattle| 60|
|Tony|Cupertino| 30|
|Mike| New York| 40|
+----+---------+---+
Method#2
df.select(df.name,df.city,df.age).show()
+----+---------+---+
|name|     city|age|
+----+---------+---+
|John|  Seattle| 60|
|Tony|Cupertino| 30|
|Mike| New York| 40|
+----+---------+---+
Method#3
from pyspark.sql.functions import col
df.select(col("name"),col("city"),col("age")).show()
+----+---------+---+
|name|     city|age|
+----+---------+---+
|John|  Seattle| 60|
|Tony|Cupertino| 30|
|Mike| New York| 40|
+----+---------+---+
Summary
print("Input                                               ",            "Output")
display_side_by_side(df.toPandas(),df_out.toPandas())
Input Output
| name | city | age | smoker | height | birthdate |
|---|---|---|---|---|---|
| John | Seattle | 60 | True | 1.70 | 1960-01-01 |
| Tony | Cupertino | 30 | False | 1.80 | 1990-01-01 |
| Mike | New York | 40 | True | 1.65 | 1980-01-01 |
| name | city | age |
|---|---|---|
| John | Seattle | 60 |
| Tony | Cupertino | 30 |
| Mike | New York | 40 |
3b. How to rename columns?
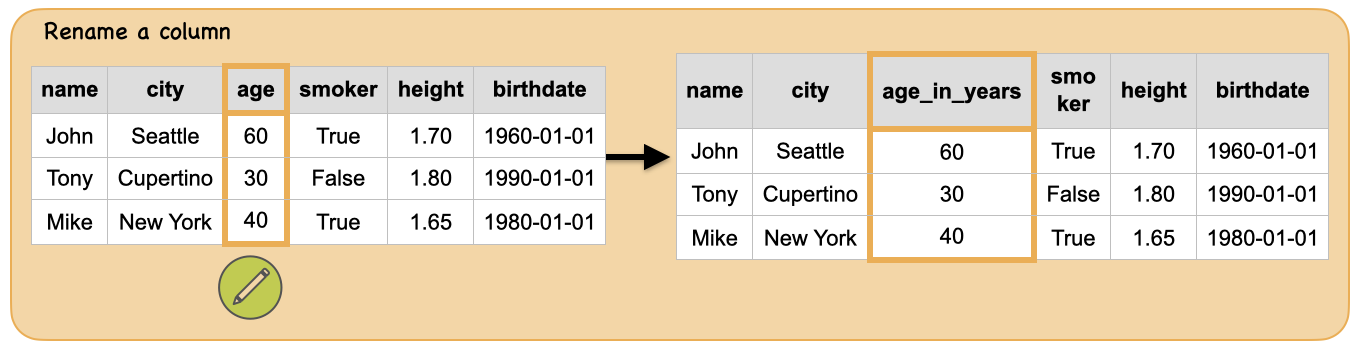
Input: Spark dataframe with one of the column “age”
df = spark.createDataFrame([('John', 'Seattle', 60, True, 1.7, '1960-01-01'),
('Tony', 'Cupertino', 30, False, 1.8, '1990-01-01'),
('Mike', 'New York', 40, True, 1.65, '1980-01-01')],['name', 'city', 'age', 'smoker','height', 'birthdate'])
df.show()
+----+---------+---+------+------+----------+
|name|     city|age|smoker|height| birthdate|
+----+---------+---+------+------+----------+
|John|  Seattle| 60|  true|   1.7|1960-01-01|
|Tony|Cupertino| 30| false|   1.8|1990-01-01|
|Mike| New York| 40|  true|  1.65|1980-01-01|
+----+---------+---+------+------+----------+
Output: spark dataframe with column “age” renamed to “age_in_years”
df.select(col("name").alias("firstname"),df.city.alias("birthcity"),df.age.alias("age_in_years")).show()
+---------+---------+------------+
|firstname|birthcity|age_in_years|
+---------+---------+------------+
|     John|  Seattle|          60|
|     Tony|Cupertino|          30|
|     Mike| New York|          40|
+---------+---------+------------+
df_rename = df.withColumnRenamed("age","age_in_years")
df_rename.show()
+----+---------+------------+------+------+----------+
|name|     city|age_in_years|smoker|height| birthdate|
+----+---------+------------+------+------+----------+
|John|  Seattle|          60|  true|   1.7|1960-01-01|
|Tony|Cupertino|          30| false|   1.8|1990-01-01|
|Mike| New York|          40|  true|  1.65|1980-01-01|
+----+---------+------------+------+------+----------+
print("Input                                               ",            "Output")
display_side_by_side(df.toPandas(),df_rename.toPandas())
Input Output
| name | city | age | smoker | height | birthdate |
|---|---|---|---|---|---|
| John | Seattle | 60 | True | 1.70 | 1960-01-01 |
| Tony | Cupertino | 30 | False | 1.80 | 1990-01-01 |
| Mike | New York | 40 | True | 1.65 | 1980-01-01 |
| name | city | age_in_years | smoker | height | birthdate |
|---|---|---|---|---|---|
| John | Seattle | 60 | True | 1.70 | 1960-01-01 |
| Tony | Cupertino | 30 | False | 1.80 | 1990-01-01 |
| Mike | New York | 40 | True | 1.65 | 1980-01-01 |
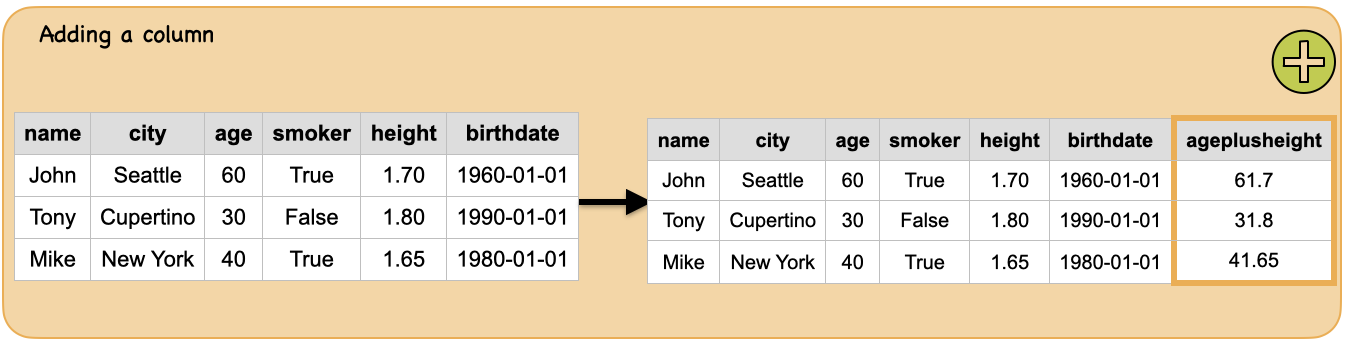
3c. How to add new columns?
Input: Spark dataframe
df = spark.createDataFrame([('John', 'Seattle', 60, True, 1.7, '1960-01-01'),
('Tony', 'Cupertino', 30, False, 1.8, '1990-01-01'),
('Mike', 'New York', 40, True, 1.65, '1980-01-01')],['name', 'city', 'age', 'smoker','height', 'birthdate'])
df.show()
+----+---------+---+------+------+----------+
|name|     city|age|smoker|height| birthdate|
+----+---------+---+------+------+----------+
|John|  Seattle| 60|  true|   1.7|1960-01-01|
|Tony|Cupertino| 30| false|   1.8|1990-01-01|
|Mike| New York| 40|  true|  1.65|1980-01-01|
+----+---------+---+------+------+----------+
Output: spark dataframe with a new column added
Method#1
df.withColumn("ageplusheight", df.age+df.height).show()
+----+---------+---+------+------+----------+-------------+
|name|     city|age|smoker|height| birthdate|ageplusheight|
+----+---------+---+------+------+----------+-------------+
|John|  Seattle| 60|  true|   1.7|1960-01-01|         61.7|
|Tony|Cupertino| 30| false|   1.8|1990-01-01|         31.8|
|Mike| New York| 40|  true|  1.65|1980-01-01|        41.65|
+----+---------+---+------+------+----------+-------------+
Method#2
df.select("*",(df.age+df.height).alias("ageplusheight")).show()
+----+---------+---+------+------+----------+-------------+
|name|     city|age|smoker|height| birthdate|ageplusheight|
+----+---------+---+------+------+----------+-------------+
|John|  Seattle| 60|  true|   1.7|1960-01-01|         61.7|
|Tony|Cupertino| 30| false|   1.8|1990-01-01|         31.8|
|Mike| New York| 40|  true|  1.65|1980-01-01|        41.65|
+----+---------+---+------+------+----------+-------------+
Method#3
from pyspark.sql.functions import lit
df.select("*",lit("true").alias("male")).show()
+----+---------+---+------+------+----------+----+
|name|     city|age|smoker|height| birthdate|male|
+----+---------+---+------+------+----------+----+
|John|  Seattle| 60|  true|   1.7|1960-01-01|true|
|Tony|Cupertino| 30| false|   1.8|1990-01-01|true|
|Mike| New York| 40|  true|  1.65|1980-01-01|true|
+----+---------+---+------+------+----------+----+
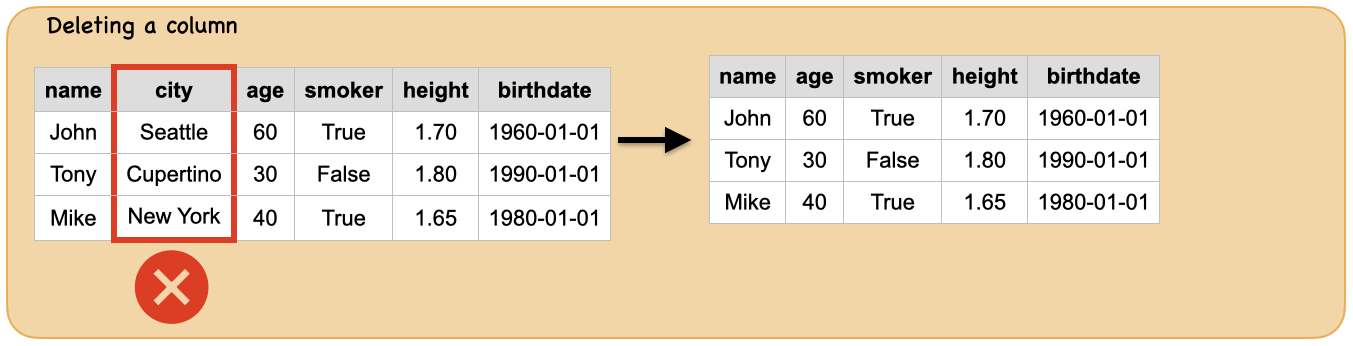
3d. How to delete columns?
Input: Spark dataframe
df = spark.createDataFrame([('John', 'Seattle', 60, True, 1.7, '1960-01-01'),
('Tony', 'Cupertino', 30, False, 1.8, '1990-01-01'),
('Mike', 'New York', 40, True, 1.65, '1980-01-01')],['name', 'city', 'age', 'smoker','height', 'birthdate'])
df.show()
+----+---------+---+------+------+----------+
|name|     city|age|smoker|height| birthdate|
+----+---------+---+------+------+----------+
|John|  Seattle| 60|  true|   1.7|1960-01-01|
|Tony|Cupertino| 30| false|   1.8|1990-01-01|
|Mike| New York| 40|  true|  1.65|1980-01-01|
+----+---------+---+------+------+----------+
Output: spark dataframe with one of the column deleted
dropping a single column
df.drop('city').show()
+----+---+------+------+----------+
|name|age|smoker|height| birthdate|
+----+---+------+------+----------+
|John| 60|  true|   1.7|1960-01-01|
|Tony| 30| false|   1.8|1990-01-01|
|Mike| 40|  true|  1.65|1980-01-01|
+----+---+------+------+----------+
dropping multiple columns
df.drop('city','birthdate').show()
+----+---+------+------+
|name|age|smoker|height|
+----+---+------+------+
|John| 60|  true|   1.7|
|Tony| 30| false|   1.8|
|Mike| 40|  true|  1.65|
+----+---+------+------+
3e. How to change the data type of columns?
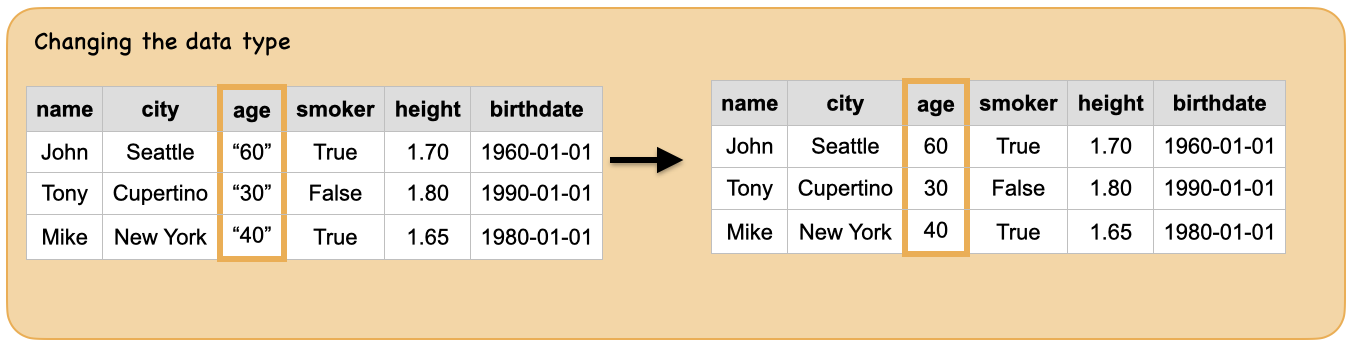
Input: Spark dataframe with column “age” of string type
df = spark.createDataFrame([('John', 'Seattle', "60", True, 1.7, '1960-01-01'),
('Tony', 'Cupertino', "30", False, 1.8, '1990-01-01'),
('Mike', 'New York', "40", True, 1.65, '1980-01-01')],['name', 'city', 'age', 'smoker','height', 'birthdate'])
df.show()
print("Data types:")
df.dtypes
+----+---------+---+------+------+----------+
|name|     city|age|smoker|height| birthdate|
+----+---------+---+------+------+----------+
|John|  Seattle| 60|  true|   1.7|1960-01-01|
|Tony|Cupertino| 30| false|   1.8|1990-01-01|
|Mike| New York| 40|  true|  1.65|1980-01-01|
+----+---------+---+------+------+----------+

Data types:
[('name', 'string'),
 ('city', 'string'),
 ('age', 'string'),
 ('smoker', 'boolean'),
 ('height', 'double'),
 ('birthdate', 'string')]
Output: spark dataframe with column “age” of integer data type
df.select("*",df.age.cast("int").alias("age_inttype")).show()
df.select("*",df.age.cast("int").alias("age_inttype")).dtypes
+----+---------+---+------+------+----------+-----------+
|name|     city|age|smoker|height| birthdate|age_inttype|
+----+---------+---+------+------+----------+-----------+
|John|  Seattle| 60|  true|   1.7|1960-01-01|         60|
|Tony|Cupertino| 30| false|   1.8|1990-01-01|         30|
|Mike| New York| 40|  true|  1.65|1980-01-01|         40|
+----+---------+---+------+------+----------+-----------+
[('name', 'string'),
 ('city', 'string'),
 ('age', 'string'),
 ('smoker', 'boolean'),
 ('height', 'double'),
 ('birthdate', 'string'),
 ('age_inttype', 'int')]
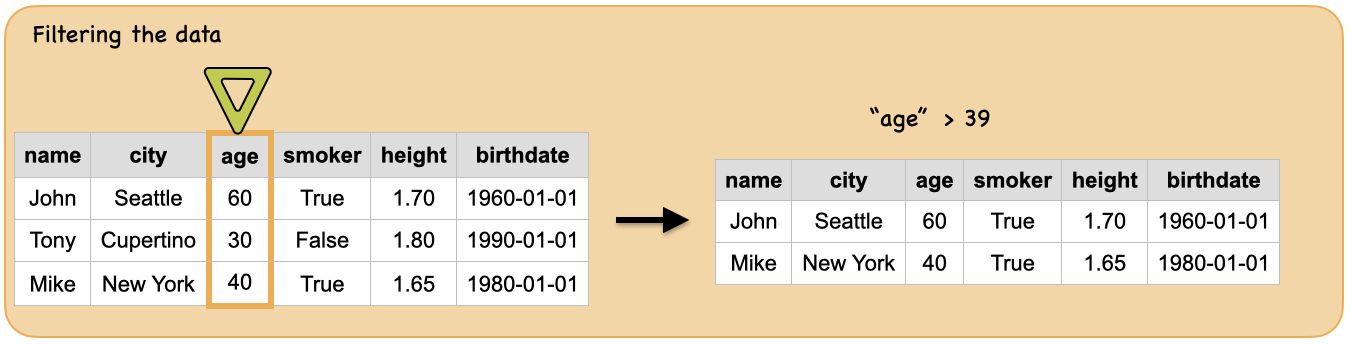
3f. How to filter the data?
Input: Spark dataframe
df = spark.createDataFrame([('John', 'Seattle', "60", True, 1.7, '1960-01-01'),
('Tony', 'Cupertino', "30", False, 1.8, '1990-01-01'),
('Mike', 'New York', "40", True, 1.65, '1980-01-01')],['name', 'city', 'age', 'smoker','height', 'birthdate'])
df.show()
print("Data types:")
df.dtypes
+----+---------+---+------+------+----------+
|name|     city|age|smoker|height| birthdate|
+----+---------+---+------+------+----------+
|John|  Seattle| 60|  true|   1.7|1960-01-01|
|Tony|Cupertino| 30| false|   1.8|1990-01-01|
|Mike| New York| 40|  true|  1.65|1980-01-01|
+----+---------+---+------+------+----------+

Data types:
[('name', 'string'),
 ('city', 'string'),
 ('age', 'string'),
 ('smoker', 'boolean'),
 ('height', 'double'),
 ('birthdate', 'string')]
Output: spark dataframe containing people whose age is more than 39
df.filter("age > 39").show()
+----+--------+---+------+------+----------+
|name|    city|age|smoker|height| birthdate|
+----+--------+---+------+------+----------+
|John| Seattle| 60|  true|   1.7|1960-01-01|
|Mike|New York| 40|  true|  1.65|1980-01-01|
+----+--------+---+------+------+----------+
df.filter(df.age > 39).show()
+----+--------+---+------+------+----------+
|name|    city|age|smoker|height| birthdate|
+----+--------+---+------+------+----------+
|John| Seattle| 60|  true|   1.7|1960-01-01|
|Mike|New York| 40|  true|  1.65|1980-01-01|
+----+--------+---+------+------+----------+